

ZIG Passenger Counting & AVL
Know Where Your Fleet Is — and How People Are Moving.
Combine real-time vehicle location, passenger counting and occupancy intelligence to improve service planning, rider information and daily operations.
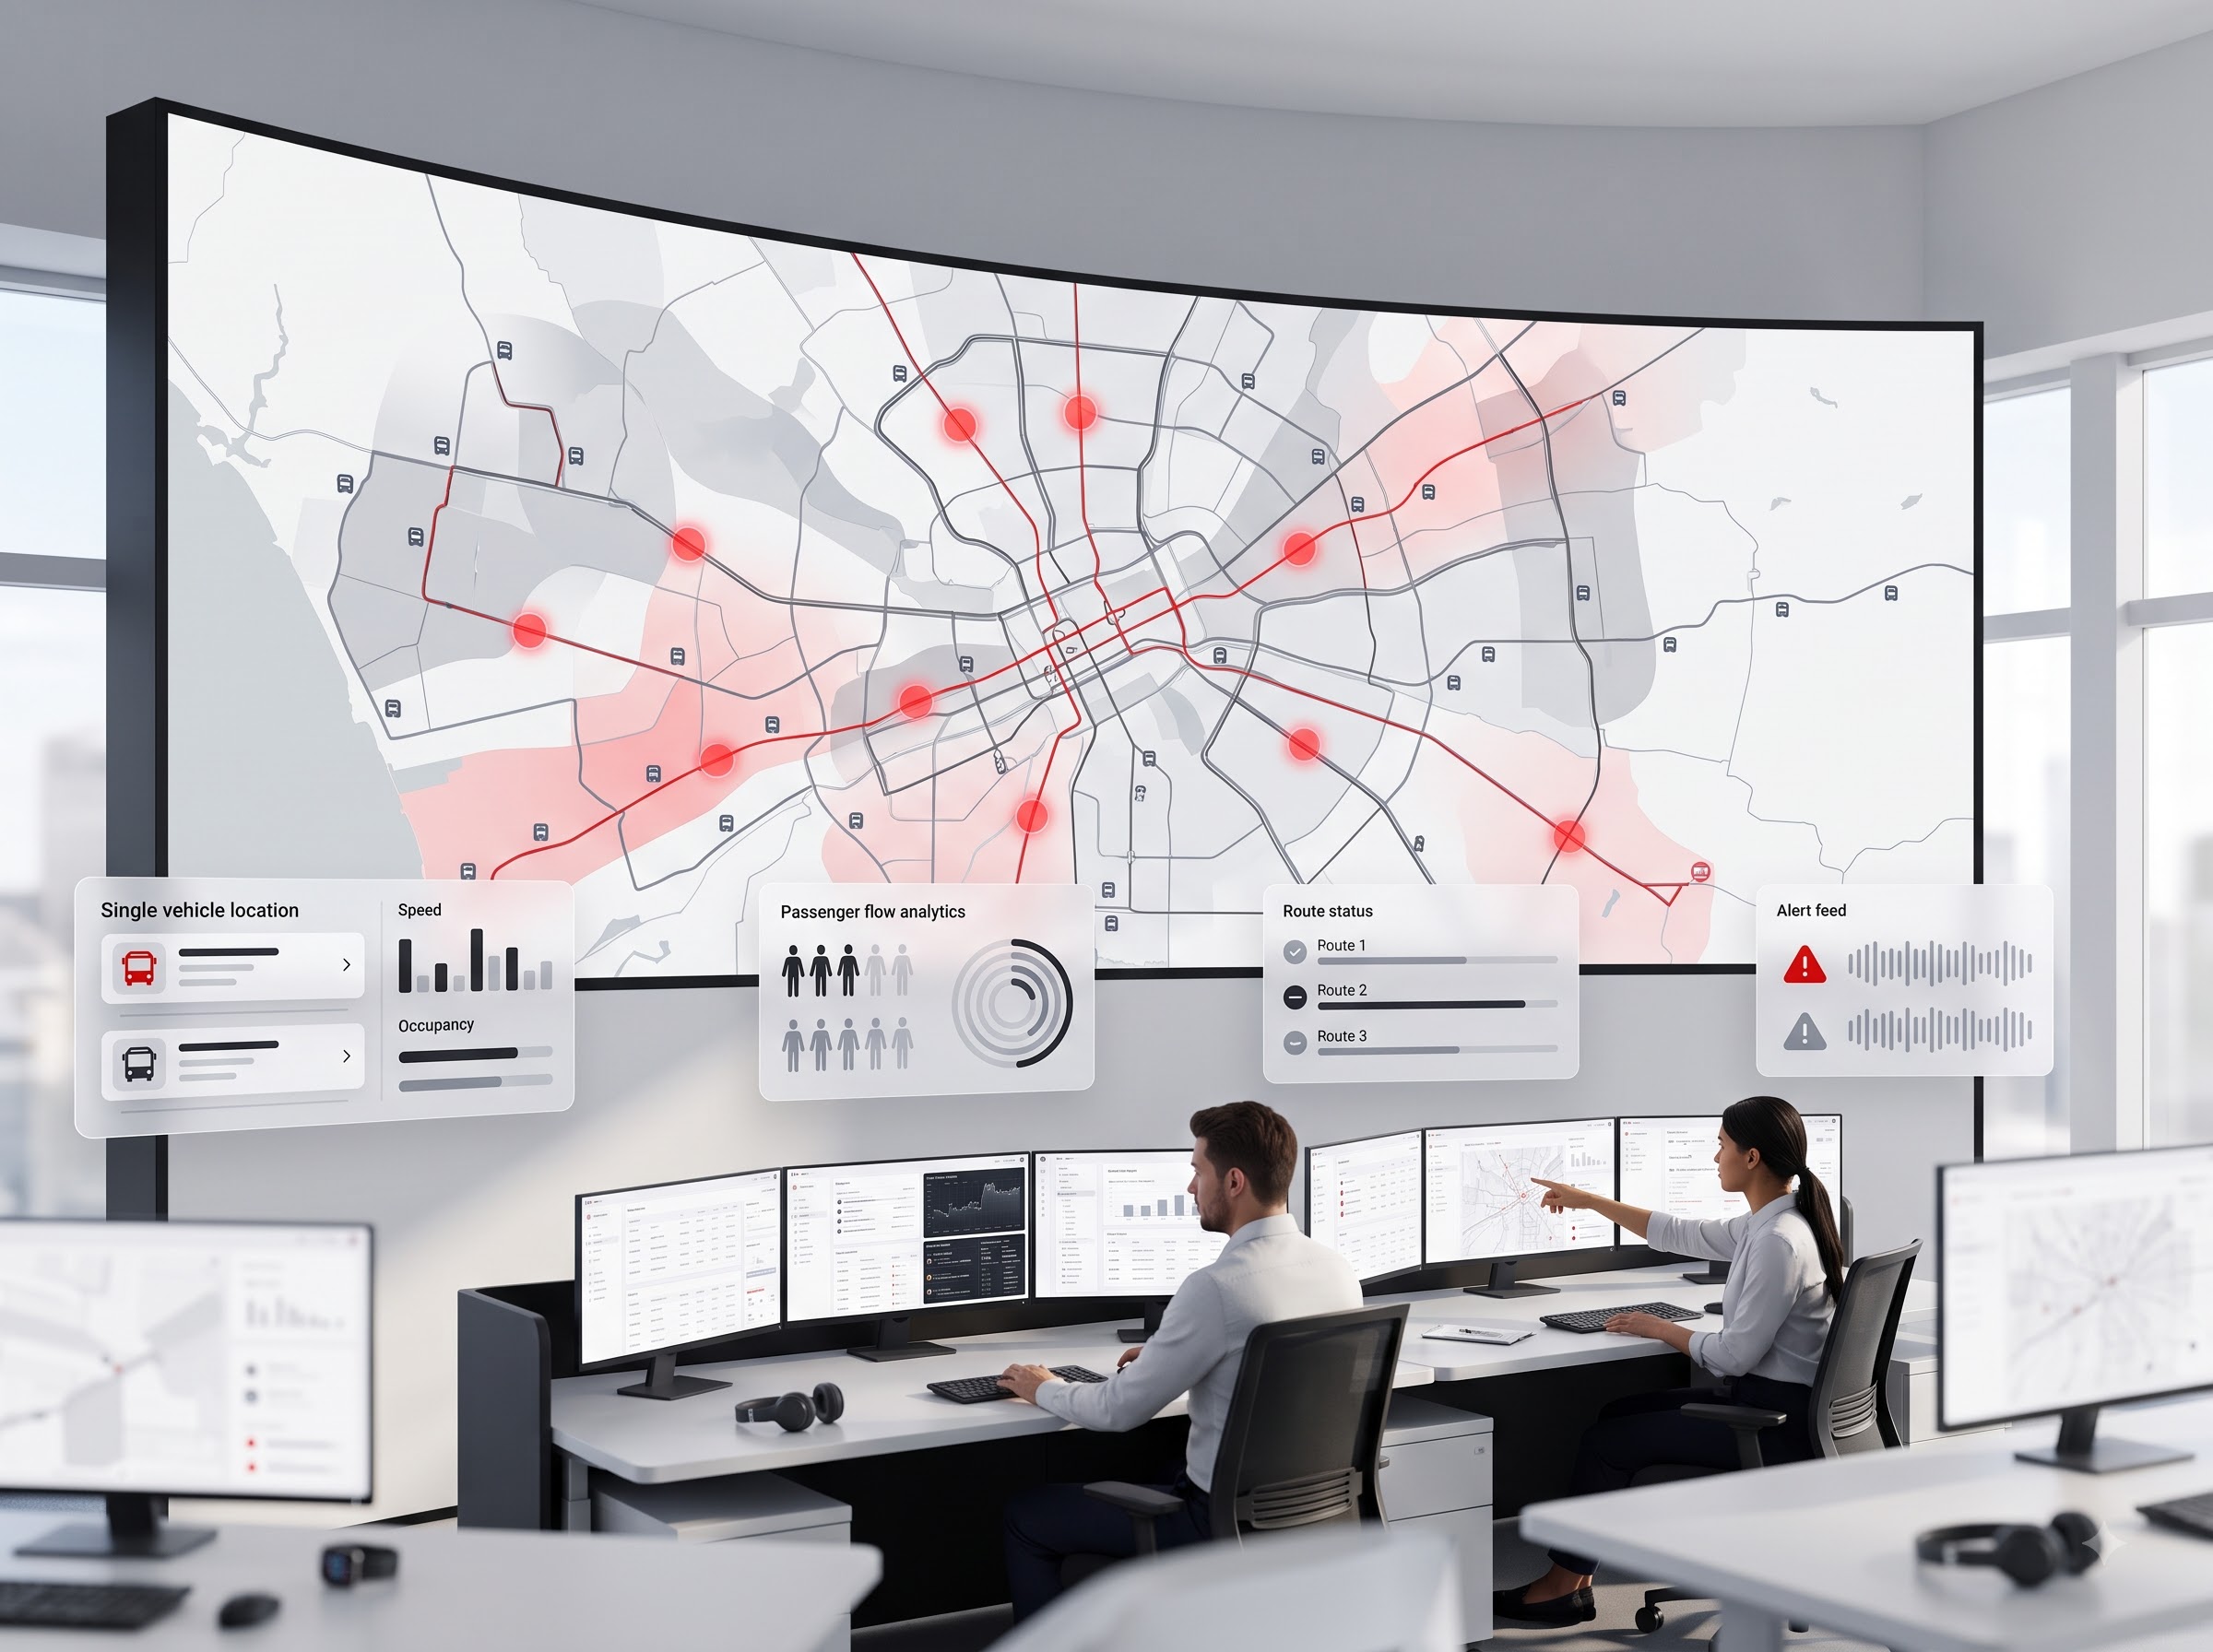
Vehicle location alone does not explain how service is performing. ZIG connects high-frequency AVL data with passenger counts, occupancy and operational reporting so agencies can see where vehicles are, how full they are and where service needs attention.
Real-Time Fleet Visibility
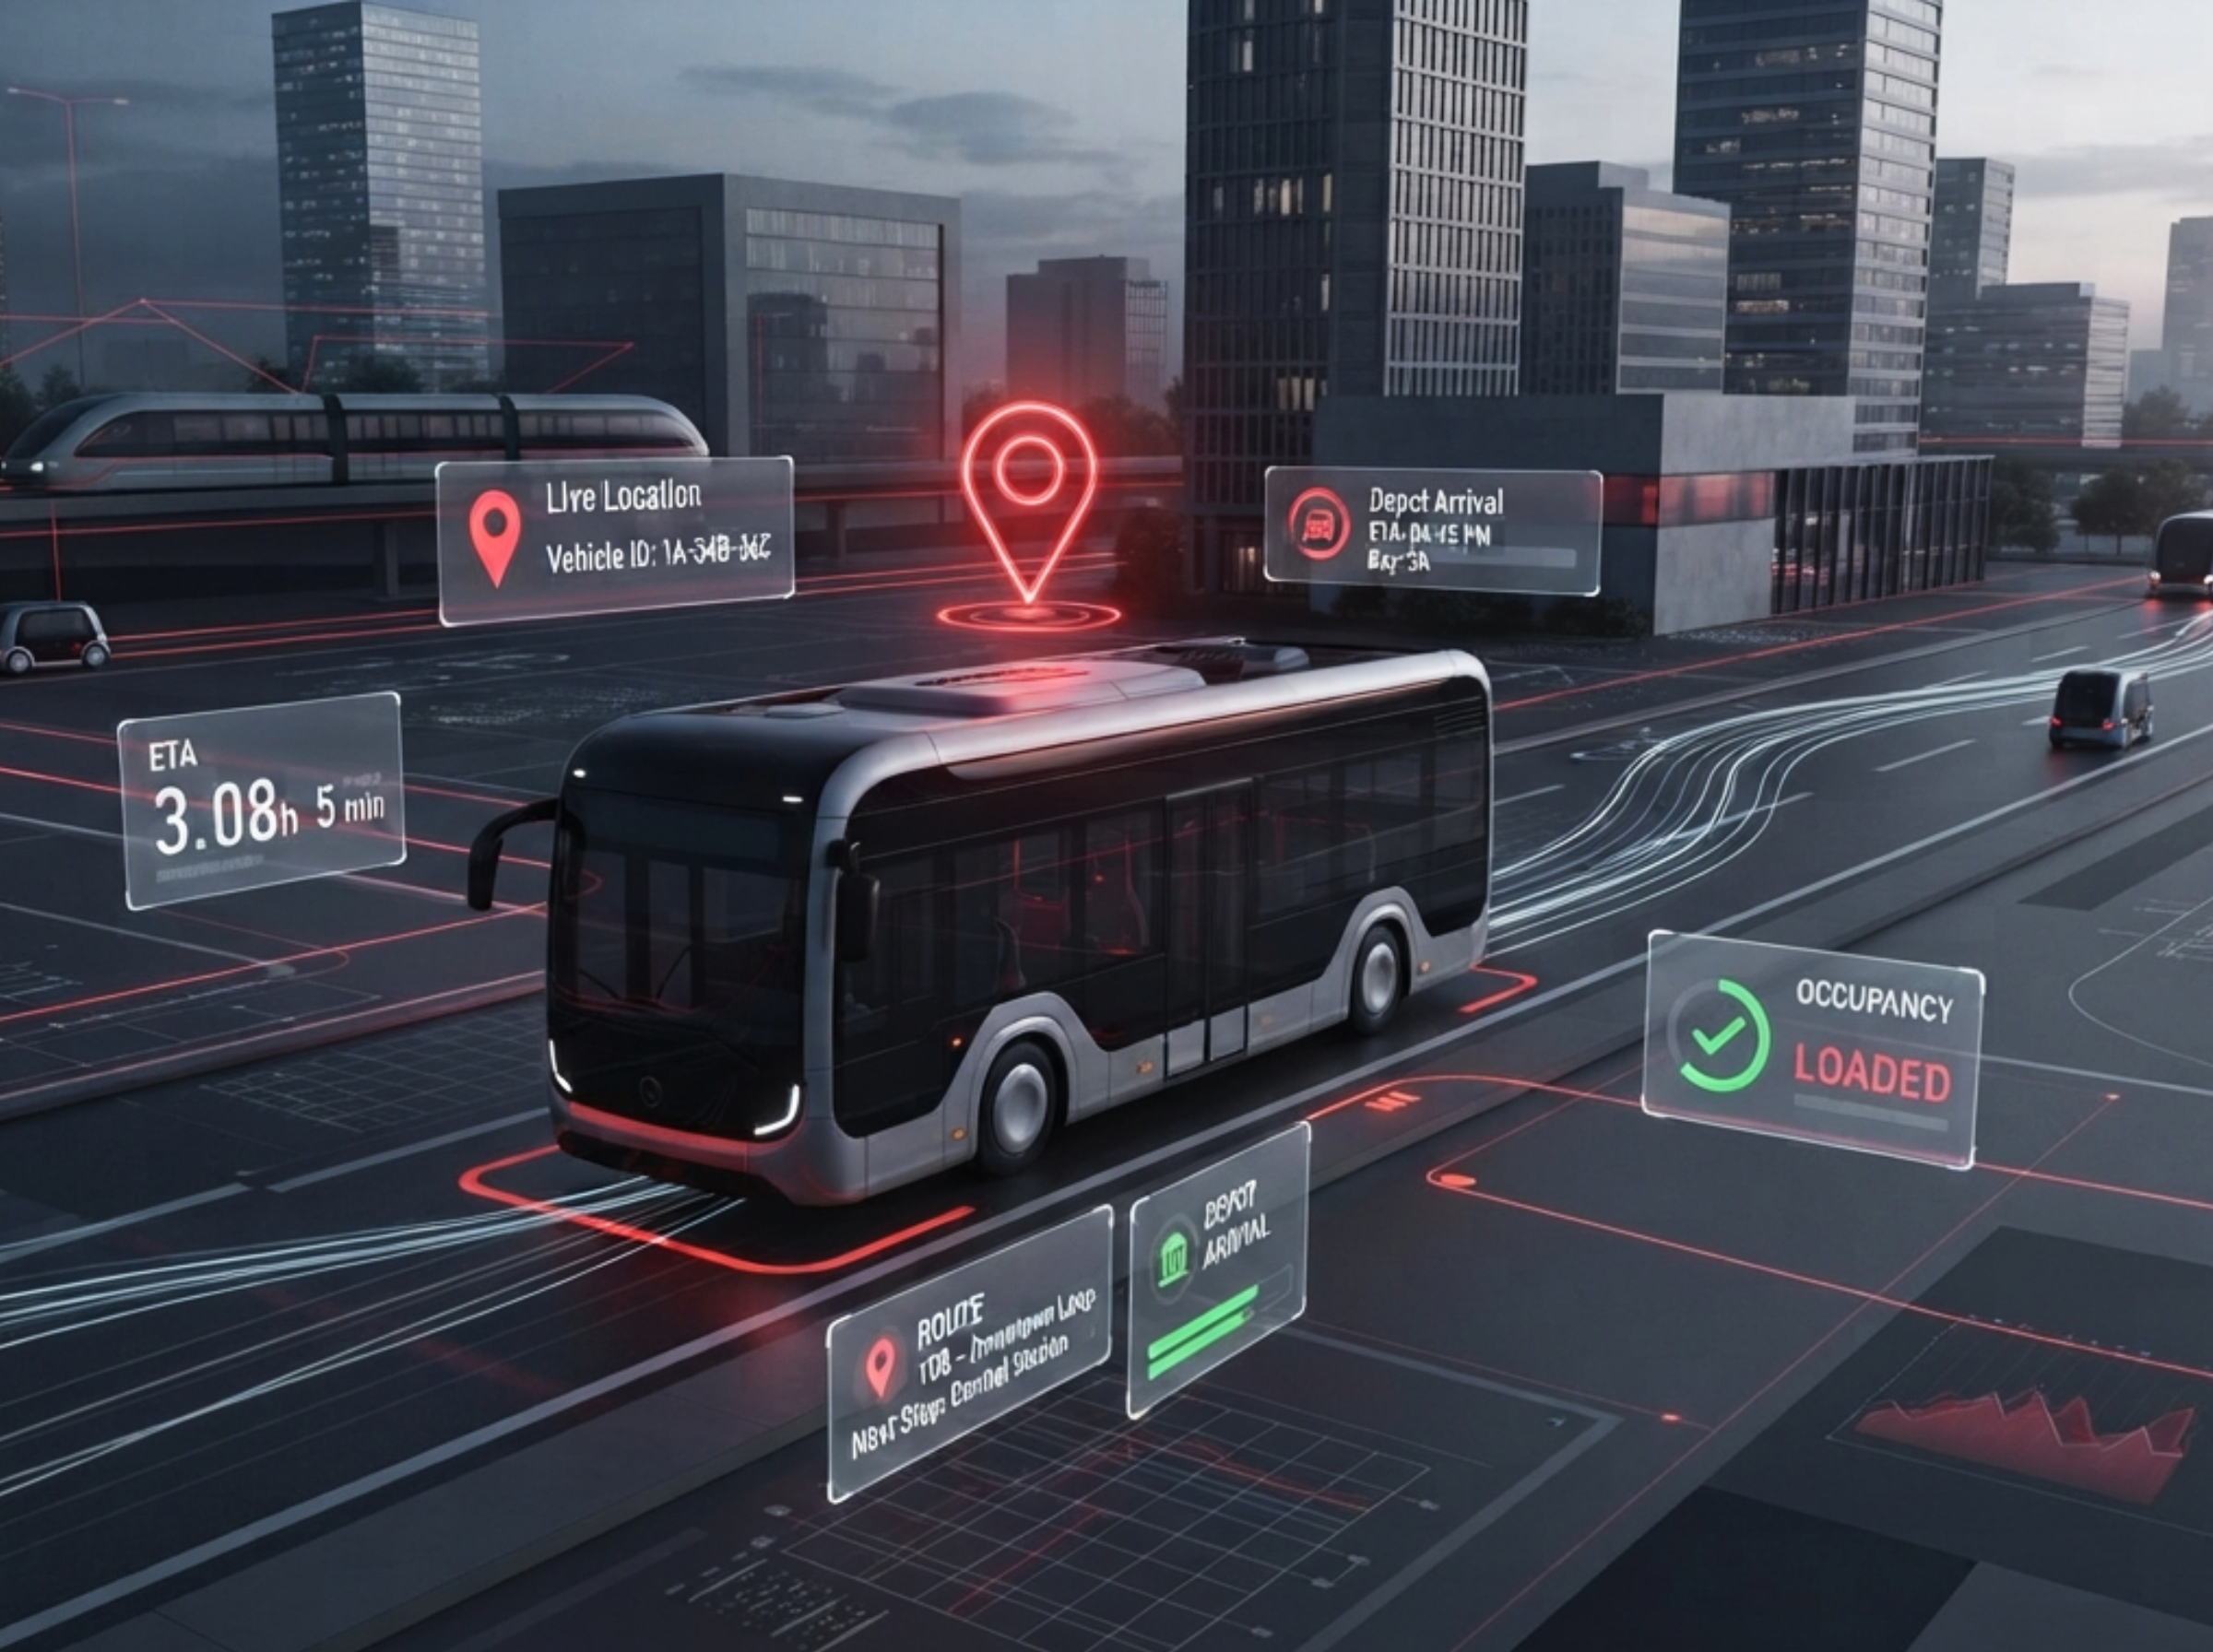
Track buses, rail, shuttles and other mobility services in real time. High-frequency location updates support more precise ETAs, depot notifications, route monitoring and faster response to service disruptions.
Live Occupancy & Crowding
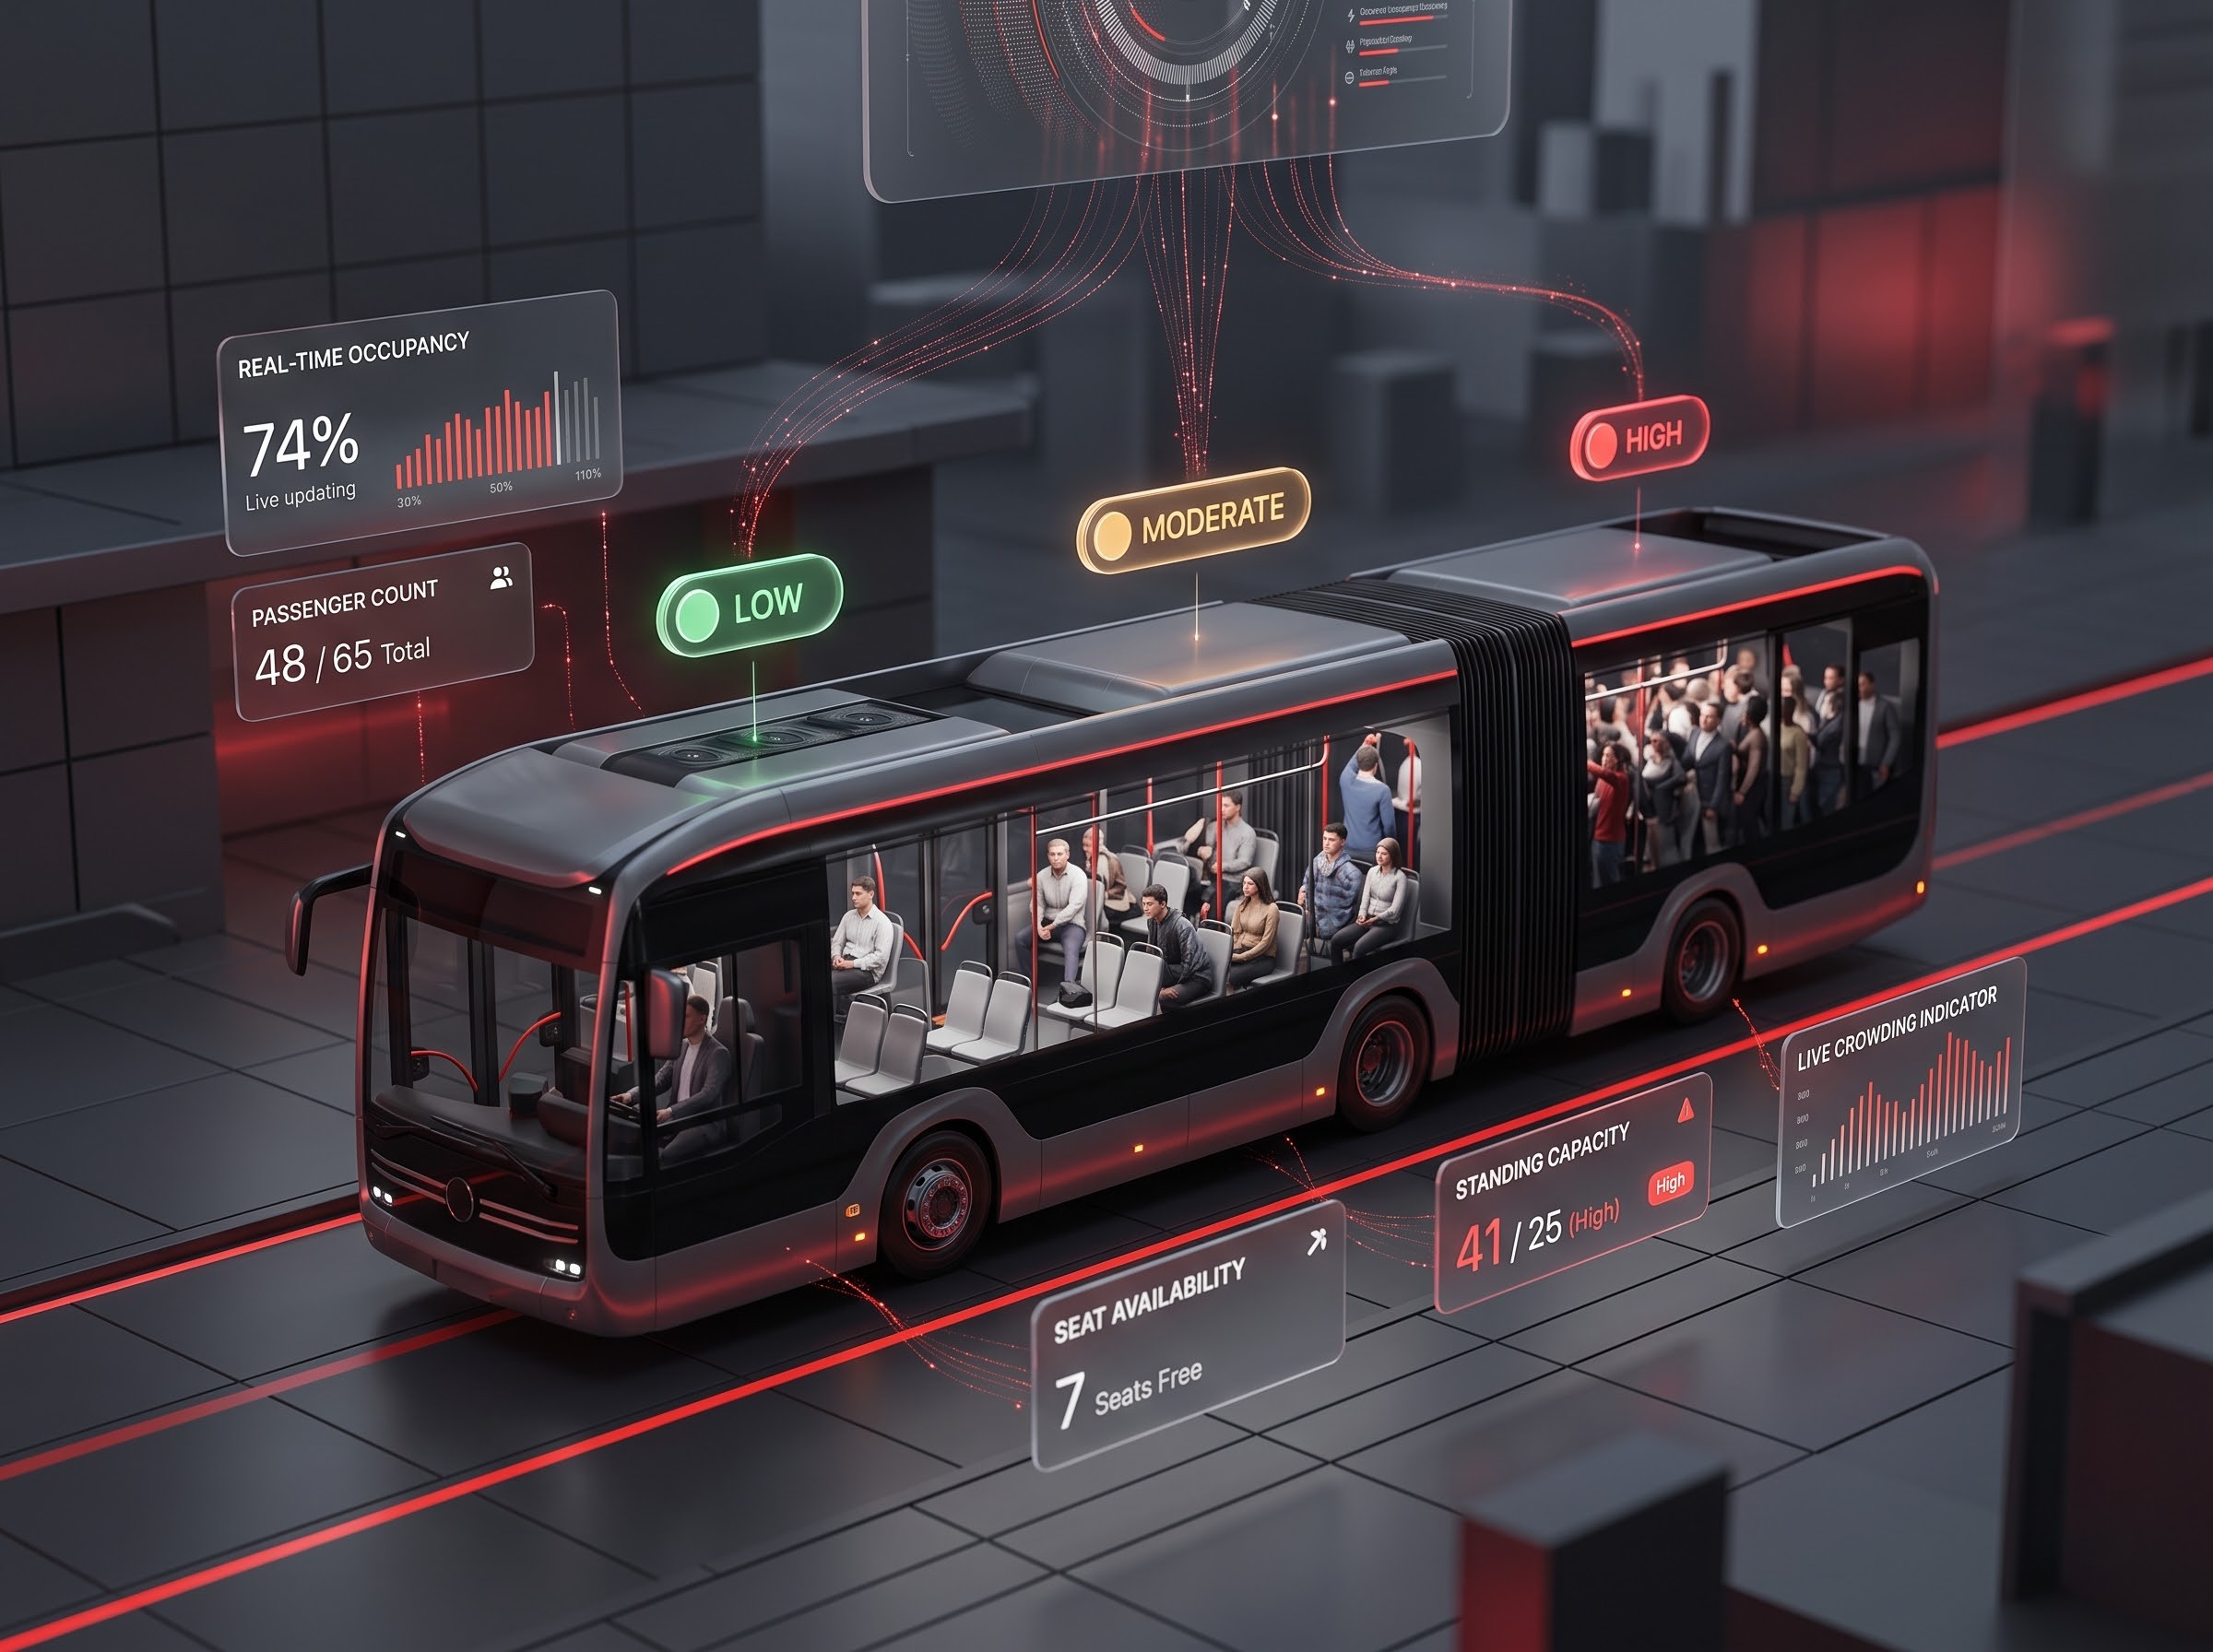
Give operations teams and riders a current view of vehicle or venue crowding. Occupancy information helps agencies manage capacity and improve communication.
Automated Passenger Counting
Measure boardings, alightings and occupancy across routes, stops and time periods. Accurate ridership data supports planning and a clearer understanding of demand.
Real-Time Reliability for Every Journey
Combine live vehicle position with traffic, road conditions and service data to improve arrival estimates and notify riders about delays. Information can be delivered through a branded app, website, API or existing rider-information system.
EXPLORE APP DEVELOPMENTOperational Reporting and Trip History
Revisit trips with route timelines, compare service performance and generate vehicle reports. Teams can review travel time, stop activity, occupancy, delays and depot arrivals to identify operational savings and service improvements.
Multimodal Intelligence
Bring together bus, rail, scooter, bike-share and ride-share information when the agency needs a broader mobility view. ZIG can also support nearby services, destinations, accessibility information and cost comparisons across modes.

Accessible Rider
Experiences
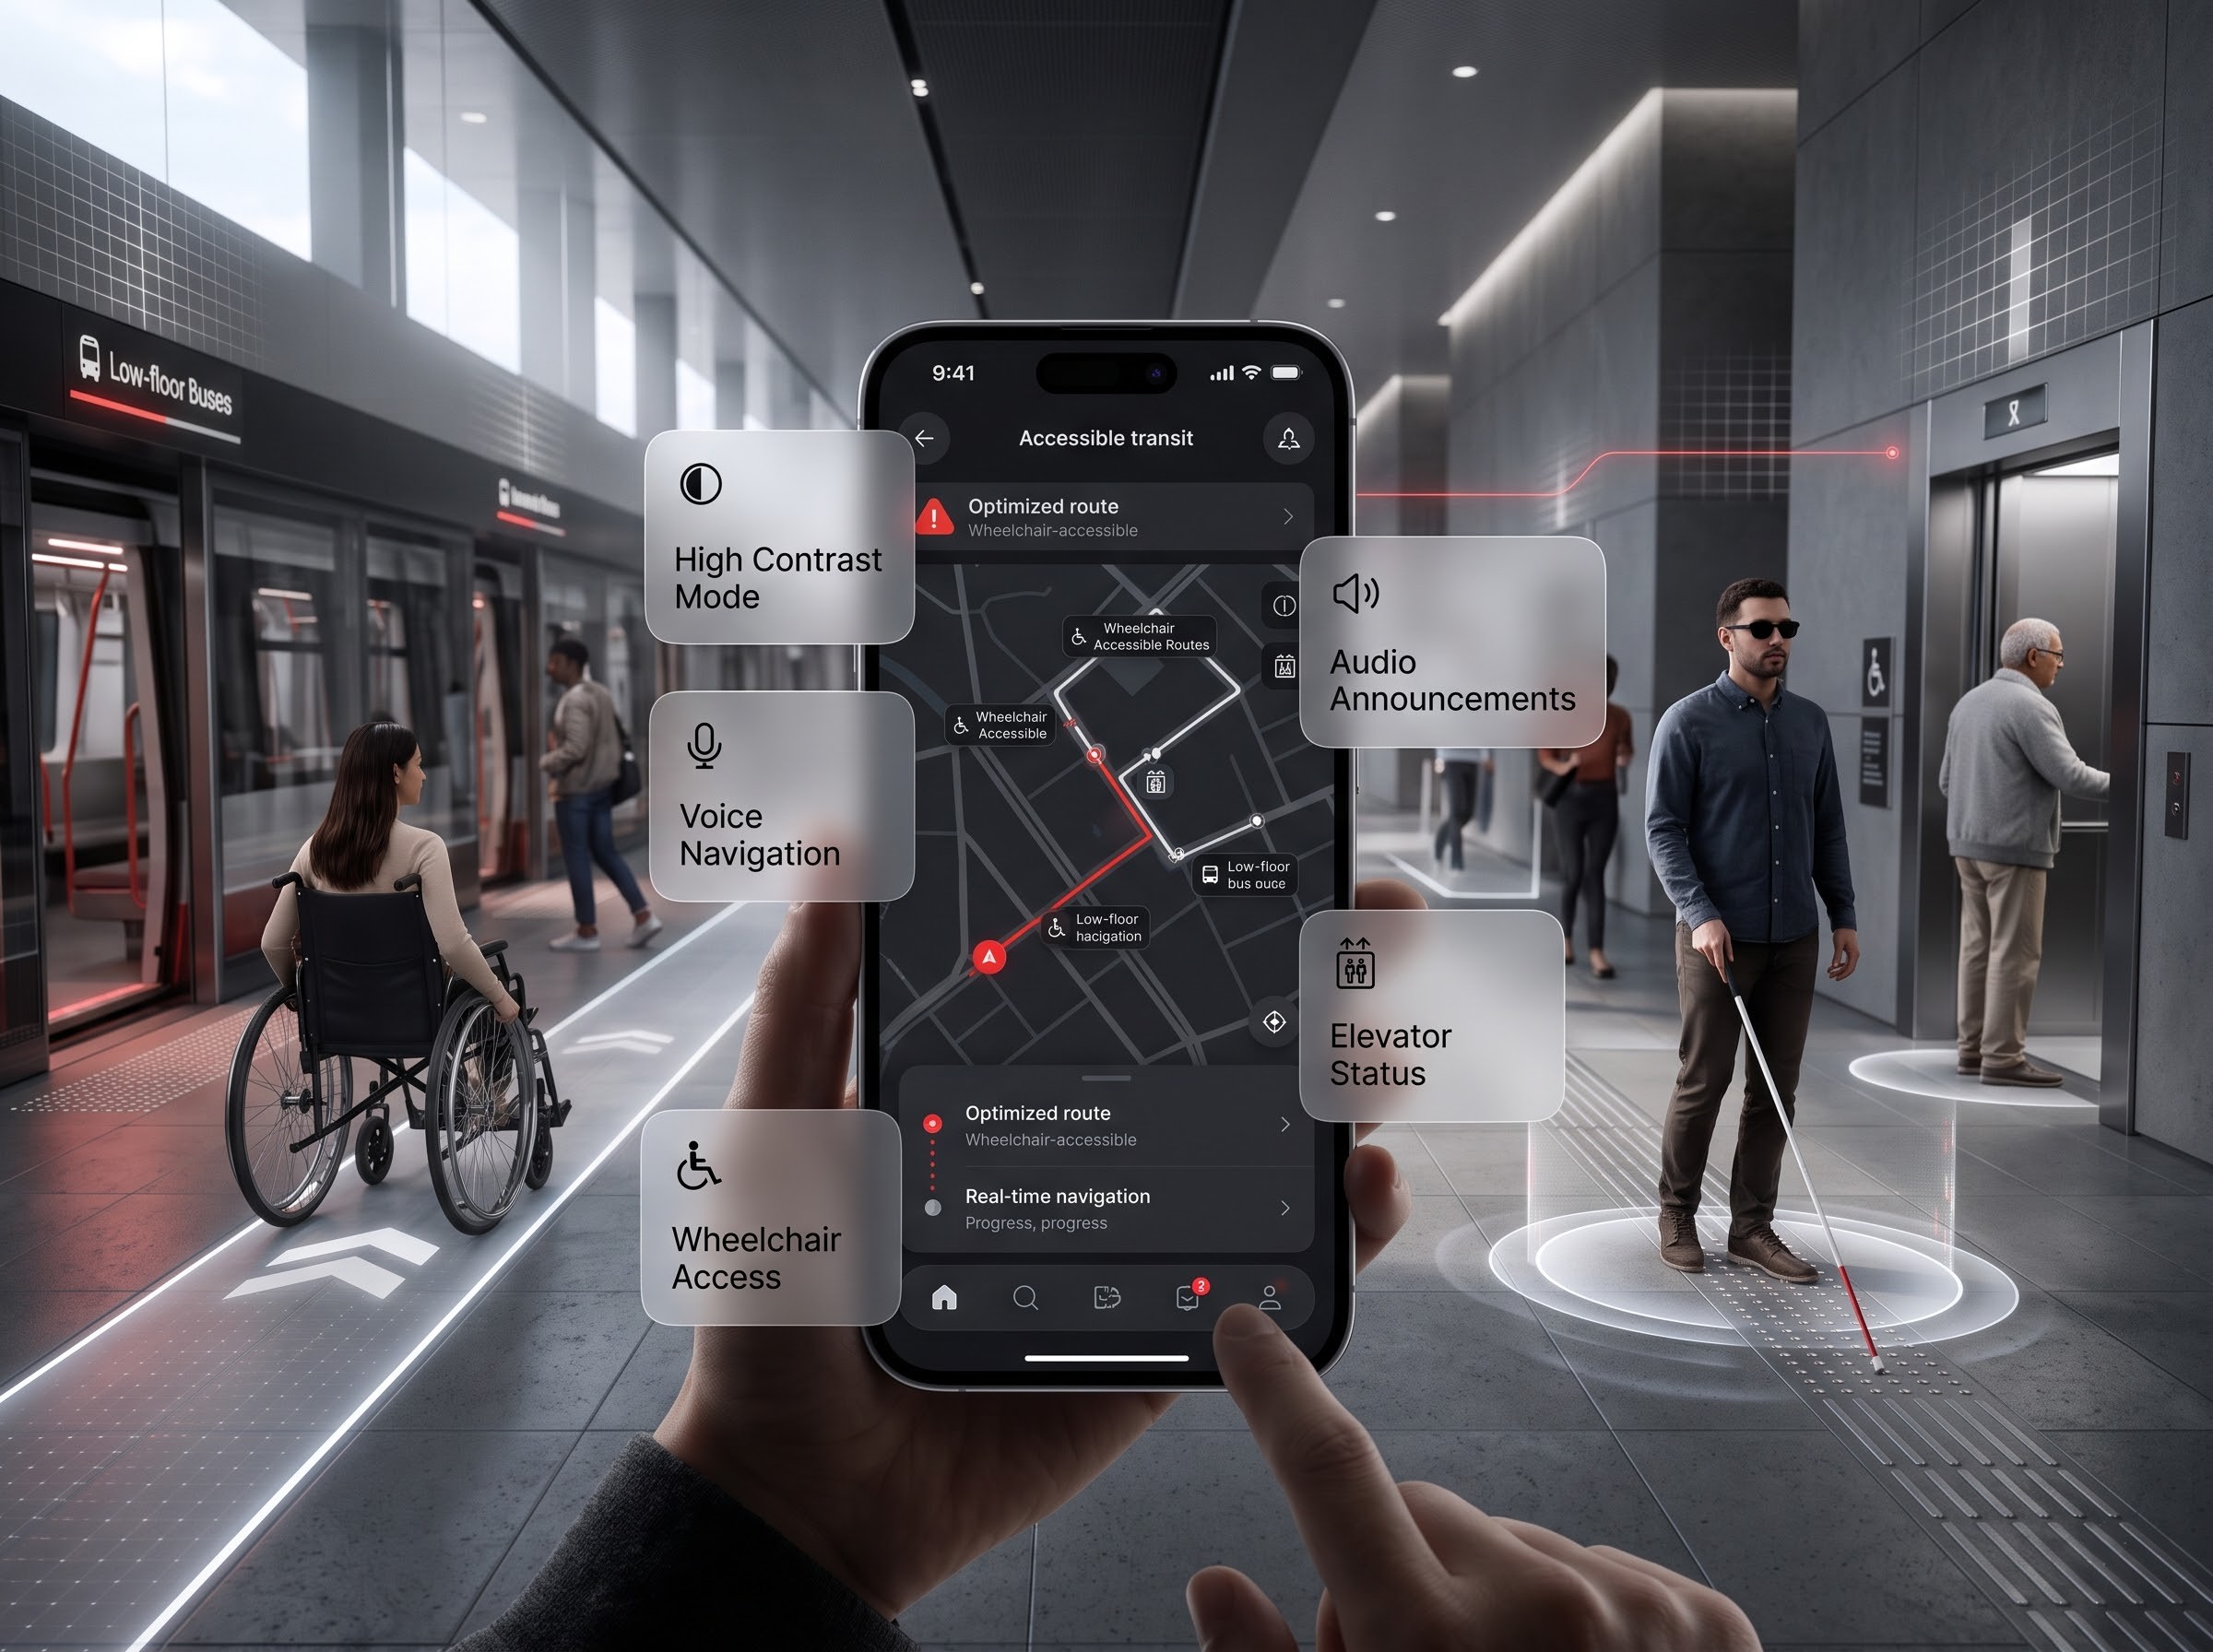
Empowering all riders with precision routing and real-time guidance. Our platform bridges the gap between infrastructure and individual needs, ensuring transit equity through high-performance data architecture.
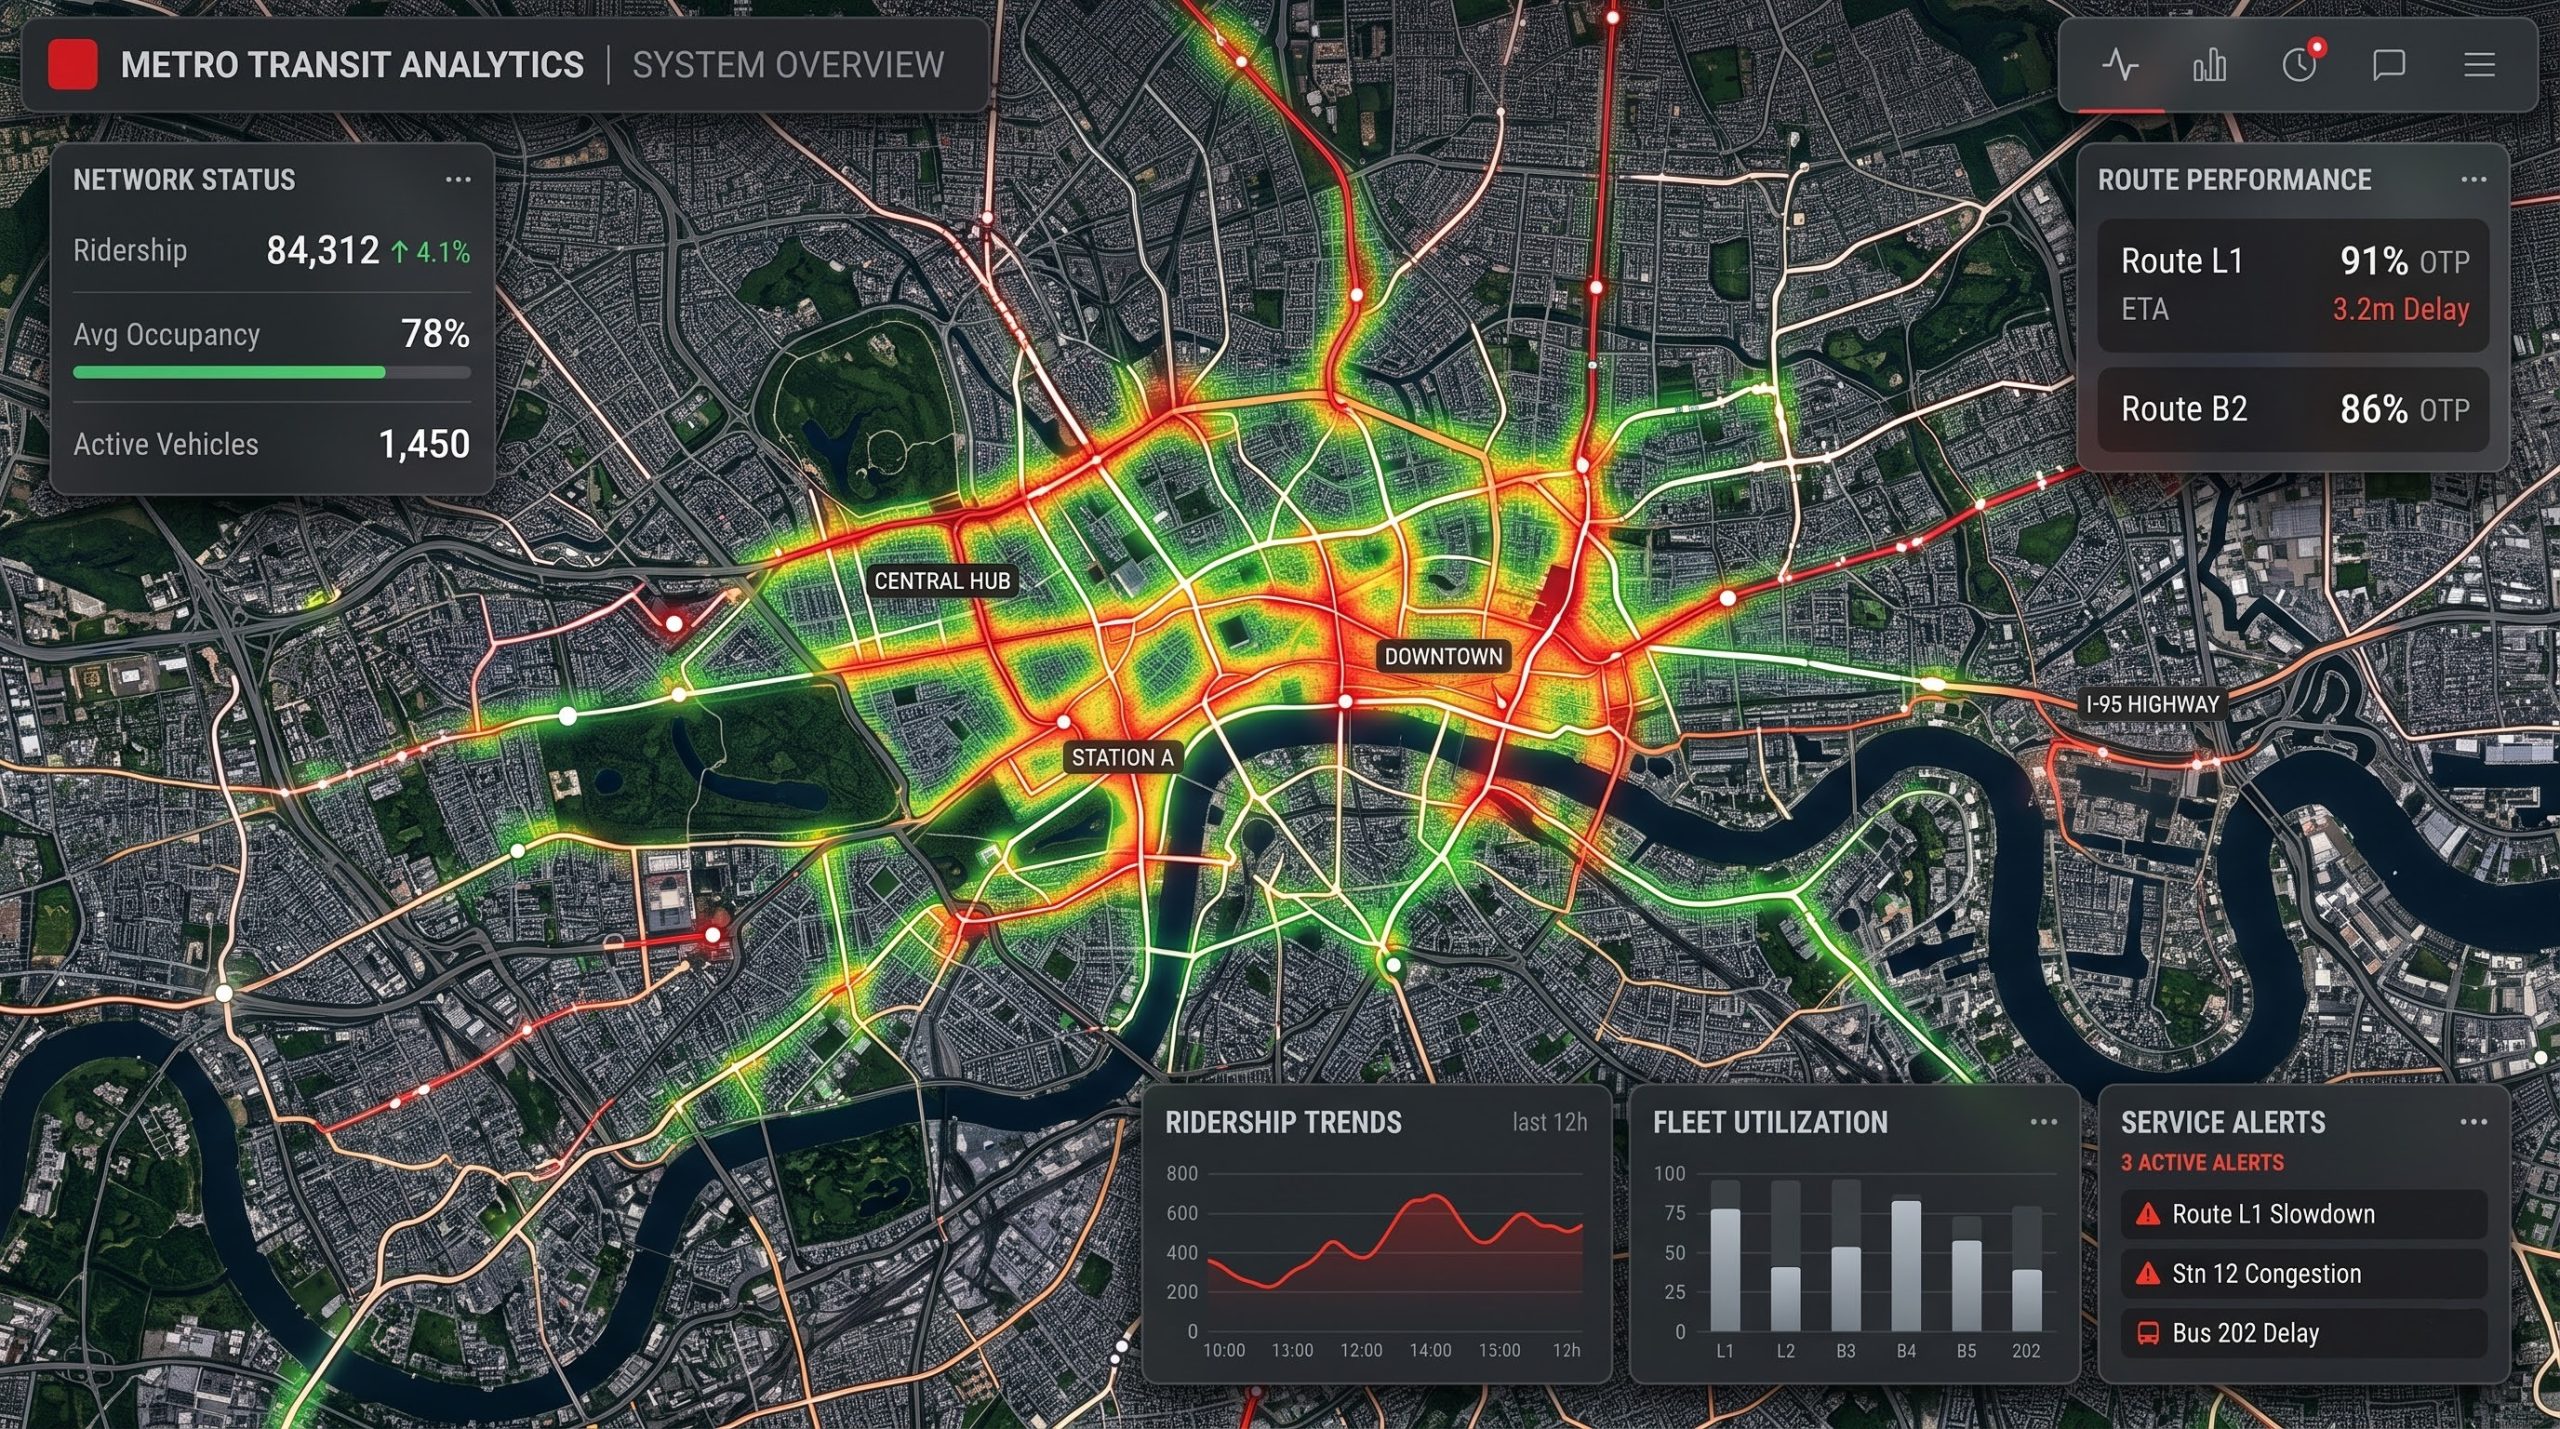
Analytics for Better Service
Planning
Harness real-time data to optimize routes, manage demand, and ensure system reliability with pinpoint accuracy.
Route Demand Heatmap
From Pilot to Fleet Deployment
Start with a defined route, vehicle group or service area. Validate location accuracy, passenger counts and reporting workflows before expanding across the fleet.
Select Route
Identify optimal test corridors.
Configure Vehicles
Install hardware and map data.
Validate Data
Ensure precision metrics.
Expand Fleet
Scale across the network.
Ready to See Your Network More Clearly?
Connect vehicle location, passenger activity and operational insight through one mobility platform.